Inside PostgreSQL · Part 1/1
How PostgreSQL executes a query
From SQL text to rows: parsing, analysis, rewriting, planning, and execution, plus where EXPLAIN ANALYZE fits and why the planner sometimes chooses the wrong path.
You paste a query into psql, press Enter, and rows appear after 40 milliseconds. In that time a backend process has turned text into a tree, checked it against the catalog, chosen among access paths, and pulled rows through a pipeline of plan nodes. There is no server-side result cache doing the work; the same query is planned and executed again on the next call.
Parsing: text to a syntax tree
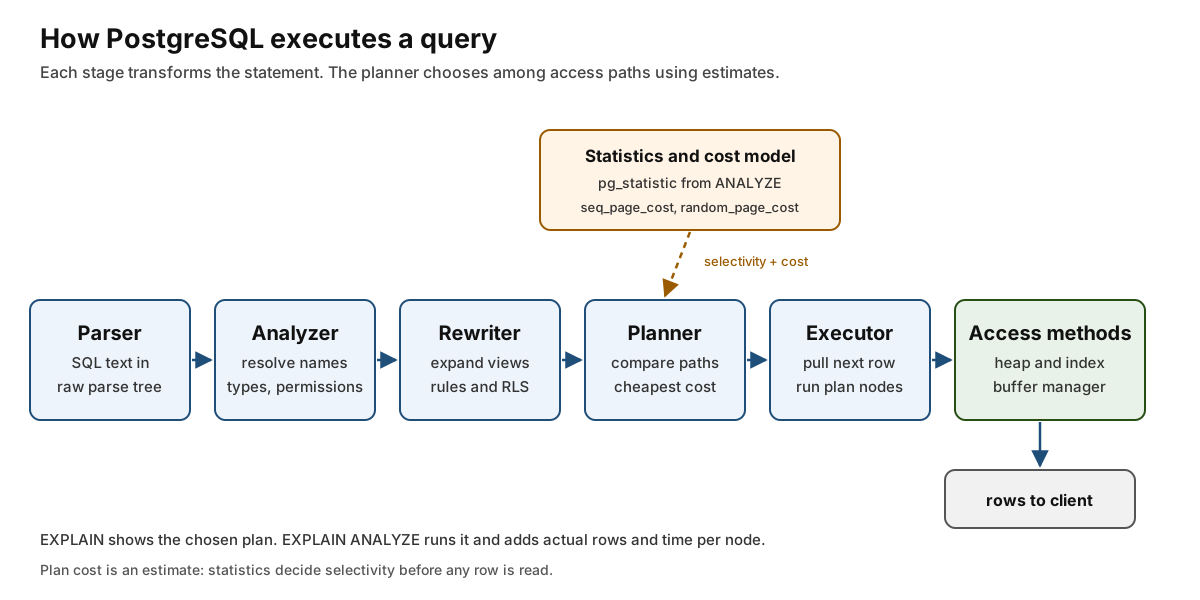
The backend receives the statement and runs it through the grammar, producing a raw parse tree. This stage checks syntax only. It does not know whether orders exists, whether a column has the type you assume, or whether your role may read it. A syntax error is reported with a position in the original string, which is why the caret in psql can point at the exact token.
Analysis and rewriting
Parse analysis resolves names to object identifiers, resolves operators and types, and replaces the raw tree with a Query tree. Views are expanded and rewrite rules are applied here, and row-level security policies are added as additional qualifications. The output is still a tree, but now every reference points at a real catalog object.
Planning: choosing a path
The planner considers ways to produce the same result: sequential scans, index scans, bitmap scans, index-only scans, and different join orders and join methods. For each candidate it estimates rows and cost, then keeps the cheapest. Estimates come from pg_statistic, maintained by ANALYZE and autovacuum, plus cost constants such as seq_page_cost, random_page_cost, and cpu_tuple_cost.
| Stage | Input | Output | Main cost driver |
|---|---|---|---|
| Parser | SQL text | raw parse tree | statement length |
| Analyzer | raw tree | Query tree with OIDs |
catalog lookups |
| Rewriter | Query tree |
expanded tree | number of rules and views |
| Planner | rewritten tree | plan tree with costs | statistics quality, search space |
| Executor | plan tree | rows | I/O, CPU, contention |
A sequential scan reads every page of the table and is often correct for small tables or when a large fraction of rows qualify. An index scan pays to descend the index and then fetches heap pages; it wins when the predicate is selective and the pages are likely cached. The planner compares those costs, not a rule about indexes being faster.
Execution and storage
The executor walks the plan tree on demand: a node asks its child for the next row, and the child returns one or stops.1 Scan nodes call the table or index access method, which goes through the shared buffer manager and, on a miss, the operating system. Visibility checks apply the query snapshot, so a row may be read from a page and then discarded because a concurrent transaction made it invisible. Sorts and hash joins spill to temporary files when they exceed work_mem.
EXPLAIN (ANALYZE, BUFFERS)
SELECT c.id, count(o.id) AS order_count
FROM customers c
JOIN orders o ON o.customer_id = c.id
WHERE c.created_at >= now() - interval '30 days'
GROUP BY c.id
ORDER BY order_count DESC
LIMIT 20;
Read the output from the innermost nodes outward. Compare estimated rows with actual rows; a large gap means the statistics or the selectivity model misled the planner. Check loops on the inner side of a nested loop, and check buffer counts to see whether the cost model’s page assumptions matched reality.
What changes under load
Plans are sensitive to data distribution, not just schema. A bulk load that outruns autovacuum leaves statistics stale, and the planner may keep choosing a nested loop after the table has grown. Bloat makes sequential scans read more pages than the live row count suggests. On SSDs, the default random_page_cost can overprice index access relative to the hardware. Prepared statements add another wrinkle: after a number of executions, a generic plan may be chosen that ignores the actual parameter values, so a query that was fast with a literal can become slow through a driver that prepares automatically.
What to carry forward
SQL execution is a pipeline of transformations, and each stage has a different failure mode: syntax, semantics, plan choice, or runtime cost. When a query is slow, first determine whether the plan is wrong or the plan is right but the work is large. EXPLAIN ANALYZE answers that question; guessing at indexes does not.
Footnotes
-
This demand-pull execution model is often called the Volcano model. It lets the executor stop early, which is what makes
LIMITcheap when the plan can produce rows incrementally. ↩